
How It Works
See the Kargo Platform: Freight Data Backed by Computer Vision
Explore performance analytics, data visualizations, exception lists, and video proof of events.
See Kargo in Action
Strategy
| Kargo | 4 min

Loading docks represent a pivotal node in warehouse automation. These critical hand-off points can deliver meaningful gains in supply chain efficiency.
But it requires your loading docks are integrated into a streamlined workflow, designed for productivity, on-time performance, and profitability.
That’s why Kargo creates current and future state process maps to guide your transition to computer vision automation. Maps give you a clear picture of your unique operations and set expectations for how they can improve.
Here, we provide an overview of the process maps Kargo provides to new customers. If you have questions or want to get started, email [email protected]
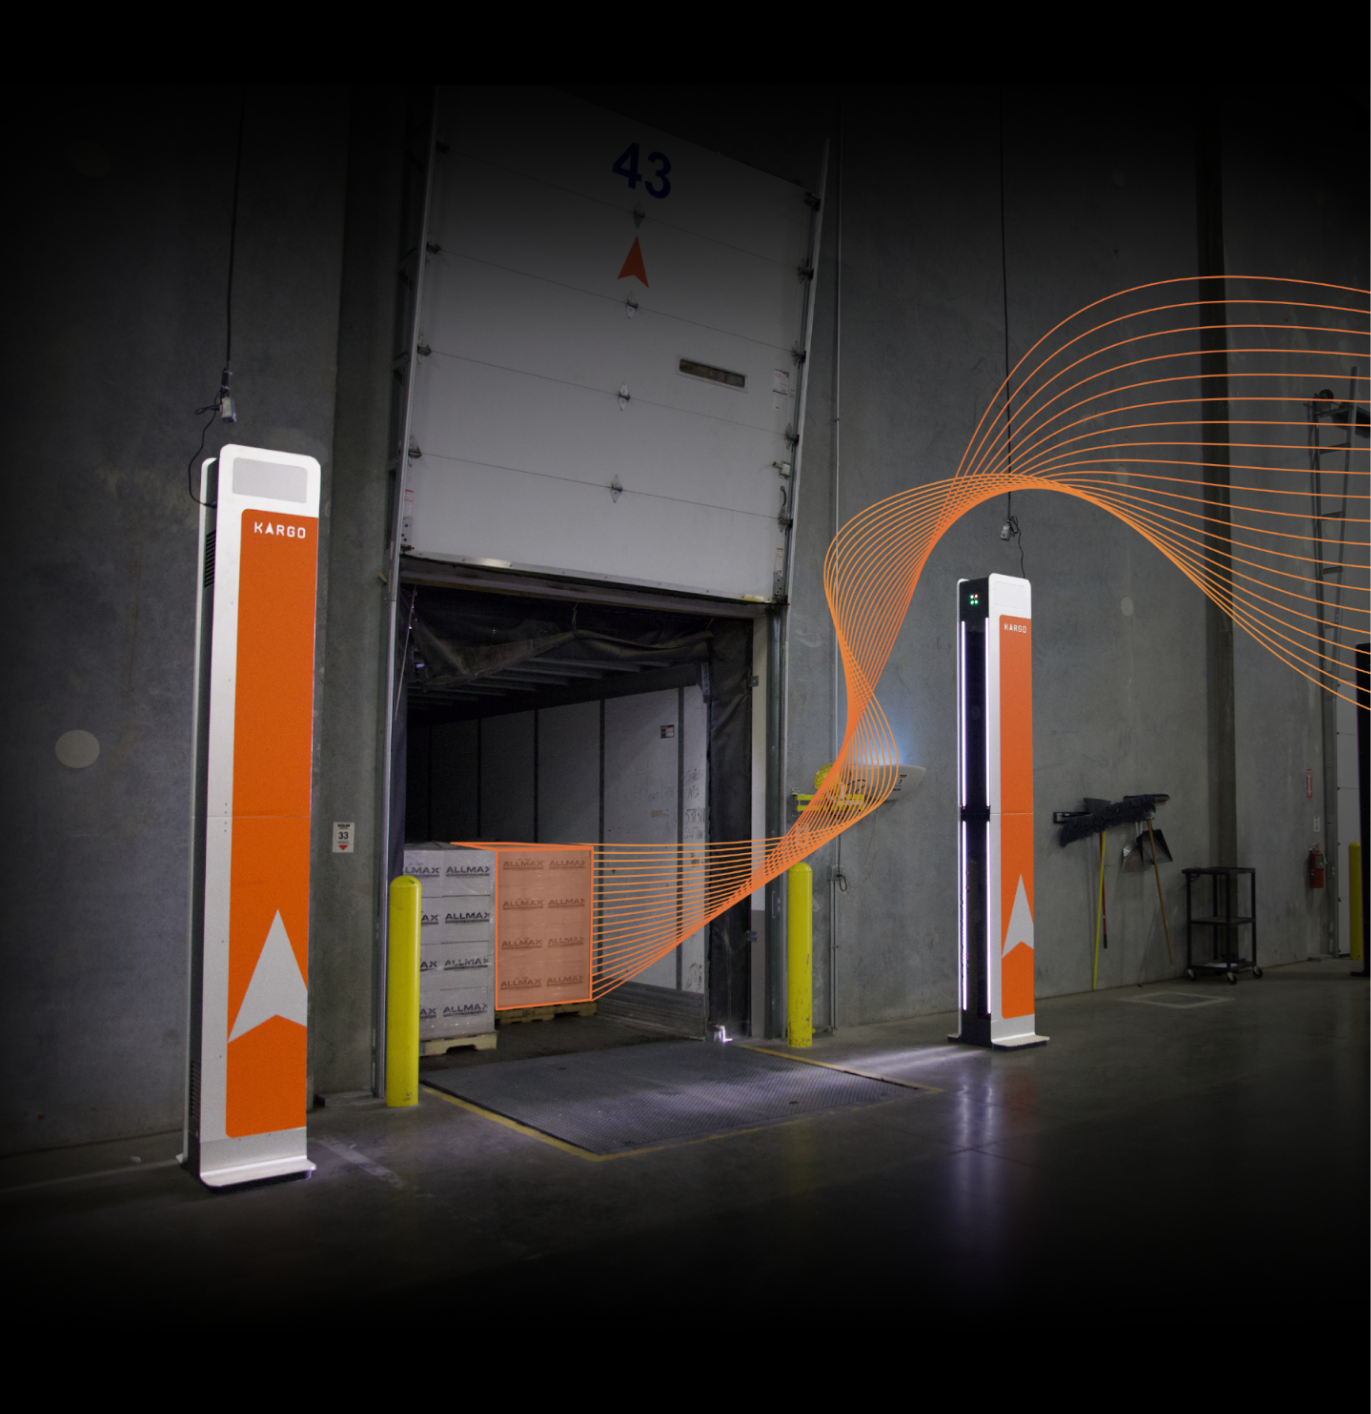
With Kargo, computer vision towers capture information from shipments and the loading dock as freight passes dock doors.
Freight label data is compared against bills of lading to verify shipment accuracy and update inventory in real time. If there are discrepancies, they’re flagged automatically to prevent errors from moving downstream.

By expanding common definitions of data to include visuals, Kargo offers contextual understanding of freight and your operations. See videos of pallets during loading and unloading, track safety violations, and resolve OS&D claims quickly and easily.
Computer vision bridges physical and digital logistics, so you can maintain complete accuracy and gather insights to continually optimize your operations.
A process map is a visual representation of your warehouse’s existing workflows and processes. It provides a high-level reference to the step-by-step sequence of activities, inputs and outputs, and interactions involved in shipping and receiving.
Process maps are valuable for aligning on complex processes and facilitating discussions for warehouse optimization.
They let your team discover where processes are bloated or falling behind the rest of the industry. When you design new process maps with Kargo, we can reveal opportunities to do more with lower cost and less effort.
Let’s take a look at a current state process map. This is representative of a generic outbound shipment. When Kargo creates a current state process map for you, it’s specific to your exact workflow, so we can discover optimization opportunities to benefit your business.

In this workflow, pallets are staged and warehouse staff remove manifest documents from freight, manually scan the pallets, load them, print an SAP load report and compare it to the manifest.
Once freight is loaded and manually verified as accurate, the truck departs. There is no proof of accuracy, just the verification by whoever compared the load report and manifest at the dock.
Updating digital management systems, like your WMS or other inventory system, is a separate workflow. It usually entails some sort of manual data entry and shipment confirmation transactions.
Now, look at a future state process map that reflects the use of computer vision towers at loading dock doors.
When Kargo creates future state maps for your organization, they may vary. We may remove other manual steps that Kargo can automate. We may also be able to include additional opportunities for value.

In this workflow, computer vision replaces the need for document management, manual scanning, and accuracy checks.
These steps are handled automatically as freight passes the dock door. Staff effort is greatly reduced — in fact, the forklift driver can usually stay in the driver’s seat during the entire loading process.
If there are exceptions, Kargo prevents them from moving further along the supply chain by notifying warehouse staff in real time.
This map features additional steps at the end of the workflow, because Kargo simultaneously automates digital platform updates as freight is loaded.
This allows your team to eliminate a separate workflow for data entry and make informed decisions immediately. A single check-out button closes the shipment at the warehouse level.
Computer vision provides a leap in efficiency and accuracy. By automating key processes, you can reduce cost and effort at scale. Process maps support optimization by visualizing workflows to surface strategic improvements.
With Kargo, process maps clarify and define how computer vision drives lasting competitive advantages.
Explore performance analytics, data visualizations, exception lists, and video proof of events.
Dock door automation can't wait. Strategize now with our automated dock door implementation guide using computer vision technology.
Shippers and 3PLs spend up to 6 figures a month or more on outdated OS&D protocols. What if you could modernize the way forward for you and your partners? This special report explains how.